Reading a landscape: what grows here, and how one site differs from the next
Every field campaign, every restoration plan and every site assessment begins with the same question, and until recently only a specialist with weeks to spare could answer it for an arbitrary patch of ground. How scattered specimen and observation records become a site species list and an environmental profile, why "little recorded" is a real answer, and what the Flora Portal now lets anyone draw and read.
- A site species list is built from occurrence records: herbarium specimens and field observations that carry coordinates. For Madagascar's plants, GBIF holds about 1.18 million such records, of which roughly 890,000 are georeferenced (GBIF, September 2026).
- Recording is uneven: global plant occurrence data are biased towards roads, research stations and protected areas, and large regions remain poorly sampled (Meyer et al., 2016). The gap between what exists and what has been recorded is the Wallacean shortfall (Hortal et al., 2015).
- The Flora Portal's Site query lets a user draw one or more areas on a map and returns the species recorded in each, the species common to all, and for each species its accepted name, family, status, endemism and environmental descriptors.
- The counts are GBIF's own, fetched live for the exact area drawn; the value added is the IsoGentiX layer on top, built on Kew's World Checklist of Vascular Plants (Govaerts et al., 2021).
- The same question has a paid market: development-bank finance requires a critical habitat assessment under IFC Performance Standard 6, and the incumbent screening tool sells subscriptions from USD 5,000 to 35,000 a year (IBAT Alliance, 2026).
- Locality-sensitive species, Critically Endangered and CITES-listed, are withheld from users not entitled to protected localities.
Stand at the edge of a forest with a notebook and the question is obvious: what grows here? Ask it about a site you have never visited, a valley proposed for a dam, a hillside a community wants to replant, a study area a student has just been assigned, and it becomes surprisingly hard. The plants have been recorded, many of them, over two centuries of collecting. The records exist. But they are scattered across herbaria on three continents, filed under names that have since changed, and stored as points on a map that nobody has drawn a line around. Turning them into an answer for one particular piece of ground has, until now, been specialist work.
This article is about that transformation: how points become a list, how a list becomes a profile of a place, why the honest answer is often "little recorded", and how the Flora Portal now does the work for any area a reader cares to draw. It ends with the uses, from conservation screening to choosing native species for restoration, and with a point about sovereignty that matters more than the software.
GBIF counts queried on 24 September 2026 for kingdom Plantae, country Madagascar (all records, and records with coordinates). Report price from the IBAT Alliance published price list (2026). How the figures update →
From a point to a place: what an occurrence record is
The raw material of any site species list is the occurrence record: one plant, identified to a name, at one place, on one date, with a person who vouches for it. The oldest are herbarium specimens, pressed plants with a label. The newest are photographs uploaded from a phone with a GPS fix. In between are decades of field notebooks, survey plots and inventories. What they share is a set of coordinates, or at least a locality that can be given coordinates, and that is what lets a computer ask which of them fall inside a line drawn on a map.
The Global Biodiversity Information Facility, GBIF, is where most of these records now meet. For Madagascar's plants it holds about 1.18 million, roughly 890,000 of them georeferenced. They come from hundreds of institutions: the Paris herbarium, Missouri Botanical Garden, Kew, the Parc Botanique et Zoologique de Tsimbazaza in Antananarivo, and citizen scientists. A record in GBIF is not a fact about a plant; it is a claim by a collector, filtered through a determination that may be decades old and a name that may since have been sunk into another. Reading a landscape from records means reading with that in mind, which is why the names layer matters as much as the points.
Why the map is patchy: the Wallacean shortfall
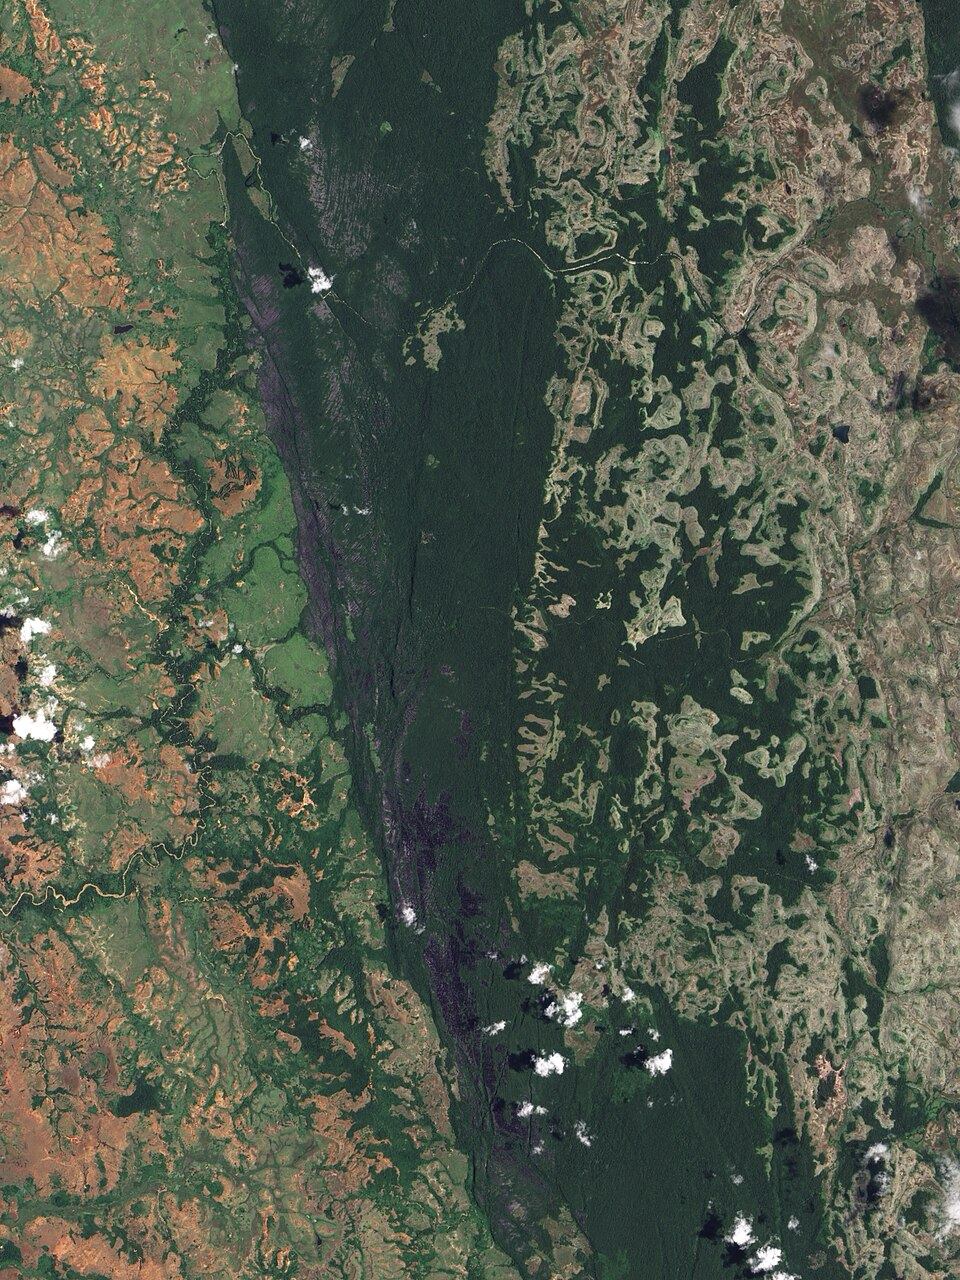
A million records sounds like a lot until they are spread across an island the size of France. They are not spread evenly. A global analysis of 120 million plant records found that coverage is strongly biased towards accessible places, wealthy institutions and charismatic groups, with large areas of the tropics almost unrecorded (Meyer et al., 2016). Madagascar is better covered than most tropical countries, thanks to two centuries of botanical attention, but the same pattern holds: dense clouds of points around Andasibe, Ranomafana and the roads out of Antananarivo, and long stretches of the west and the interior with a handful of specimens or none.
Ecologists have a name for this: the Wallacean shortfall, the gap between where species actually occur and where they have been recorded, one of seven such shortfalls that limit what can be known about biodiversity at scale (Hortal et al., 2015). Its practical consequence is that a site query will sometimes return three species, or none, for an area that a botanist could walk in an afternoon and fill a notebook. That is not a failure of the tool. It is a measurement of ignorance, and often the strongest possible argument for putting a team in the field.
An empty result for a patch of forest is not a blank. It is a finding: nobody has recorded what grows there, and someone should.
What the portal does: draw a shape, read a list
The Flora Portal has always held a curated sample of occurrence records, about fifty points per species, which is enough to draw a distribution map for each plant but not enough to answer a spatial question accurately. So for the Site query the portal does something different. When a user draws an area, one polygon, several, or a line of them along a transect, the portal asks GBIF live for every record inside that exact shape, where the full occurrence set lives. It then wraps GBIF's counts in the data GBIF does not carry: the accepted name under Kew's World Checklist, the family, the conservation status, whether the species is endemic to Madagascar, the genomic tier, and the environmental descriptors that say what makes it distinct: elevation span, biome, ecoregion, growth form and climate class.
Stated plainly, because it matters for trust: the portal does not store a copy of GBIF, and it does not pretend its own sample is the whole picture. The record counts a user sees are GBIF's counts. A reader who checks them against GBIF directly will find they agree, because they are the same numbers. What the portal adds is the layer that turns a list of occurrences into something a person can act on.
Reading the differences: a transect across Andohahela
The most useful thing a site query can do is not describe one place but compare several. Madagascar offers a textbook place to try it. In the far south-east, the Andohahela protected area straddles the line where the island's wet and dry halves meet. Its eastern parcel is evergreen humid forest taking more than 2,000 mm of rain a year; its western parcel, a short distance away across the Anosy mountains, is spiny thicket on about 500 mm; a third, transitional parcel lies between them. A 1999 inventory of the reserve, organised explicitly around elevation and this rainfall gradient, documented the turnover of plants and animals from one end to the other (Goodman, 1999).
Draw three or four areas along that gradient and the portal returns the species recorded in each and the species common to all of them. The interesting reading is in the differences. Which families dominate the wet end and vanish from the dry? Which species are shared, and what do their elevation spans, biomes and climate classes say about how they manage it? A transect like this is a natural experiment, and the environmental descriptors attached to each species are what let a reader interpret it rather than just count it. Rainfall and temperature spans for each species are being added next, from a climate layer; elevation, biome, ecoregion, growth form and climate class are shown today.
What it is for
Four uses stand out, and none of them is academic.
Conservation and critical-habitat screening. Any project that takes money from a development bank must assess whether it touches critical habitat under the International Finance Corporation's Performance Standard 6, which covers areas of high biodiversity value, including habitat of Critically Endangered and Endangered species and of endemic or restricted-range species (IFC, 2012; Guidance Note updated 2019). The established screening tool, the Integrated Biodiversity Assessment Tool, answers at the level of protected areas, Key Biodiversity Areas and species range maps; its published prices run from USD 750 for a single proximity report to USD 35,000 a year for unlimited access (IBAT Alliance, 2026). What it cannot say is which plants are actually recorded at the site. A site species list with threat status and endemism attached fills exactly that gap. It is a screening input, not the assessment, and a field survey remains the standard.
Restoration and carbon projects. Planting the wrong species is the commonest failure in reforestation. A list of what has been recorded within a few kilometres of a site, filtered to native and endemic species with the right growth form and elevation span, is the natural starting point for a planting list, and it comes with the provenance to defend the choice.
Research sites and teaching. A student assigned a study area can characterise it in an afternoon: what is recorded, what is missing, which families are over-represented, where the nearest well-sampled area lies. The comparison mode turns a single site into a question about gradients, which is where most of the interesting ecology is.
Nature disclosure. The Taskforce on Nature-related Financial Disclosures asks companies first to locate their interfaces with nature and then to evaluate dependencies and impacts at those locations (TNFD, 2023). A site-level species list is the plant half of that evaluation, and it can be run for every site in a portfolio.
The records of Madagascar's plants have existed for two hundred years. Most of the specimens they describe sit in Europe and North America. What did not exist, until now, was the ability of a Malagasy scientist, a ministry officer or a community to ask, of any patch of their own country, what has been recorded there, and to get an answer with names they can trust, in minutes, without asking anyone's permission. That is a small change in software and a larger one in who gets to read the landscape.
Decoding is protecting
A site species list is a modest object: a table, a few hundred rows at most. But it is the point where two centuries of collecting finally meets the questions people actually ask, which are nearly always about a place. Building that table honestly, from the full public record, with names reconciled to the world checklist, with status and endemism attached and rare localities protected, is precisely the work the Flora Portal exists to do. The tool is in the portal now, under the analysis tools, as Site query. Draw a shape. Read what is there, and what is not. Decode:Protect.
Common questions
What is a site species list and where does it come from?
A list of the plant species that have been recorded inside a defined area, built from occurrence records: herbarium specimens and field observations with coordinates. The Flora Portal's Site query asks GBIF live for every record inside the area you draw, then adds the accepted name, family, conservation status, endemism and environmental descriptors from the IsoGentiX layer.
Why does a site query sometimes return almost nothing?
Because plant recording is uneven. Roads, research stations and protected areas are well sampled; much of the rest of Madagascar has few or no georeferenced records. An empty or thin result is a genuine finding about the state of knowledge, the Wallacean shortfall, and often the strongest argument for a field survey.
Can a site query be used for a critical habitat assessment?
It is a screening input, not the assessment itself. IFC Performance Standard 6 requires a critical habitat assessment for projects financed by development banks, normally starting with a desk screen of protected areas, Key Biodiversity Areas and species ranges. A site-level species list adds what those layers cannot: which plants are actually recorded at the site, with threat status and endemism. Field survey and expert review remain essential.
Does the Site query reveal where rare plants grow?
No. Locality-sensitive species, including Critically Endangered and CITES-listed plants, are withheld from users who are not entitled to protected localities, so a query cannot be used to locate a rare plant for collection.
Sources and further reading
- GBIF (2026). Occurrence records, kingdom Plantae, country Madagascar. Global Biodiversity Information Facility. gbif.org, the live occurrence set queried by the Site query; counts as of 24 September 2026.
- Meyer, C., Weigelt, P. & Kreft, H. (2016). Multidimensional biases, gaps and uncertainties in global plant occurrence information. Ecology Letters, 19(8), 992–1006. onlinelibrary.wiley.com, the global analysis of 120 million plant records and where they are missing.
- Hortal, J., de Bello, F., Diniz-Filho, J.A.F., Lewinsohn, T.M., Lobo, J.M. & Ladle, R.J. (2015). Seven shortfalls that beset large-scale knowledge of biodiversity. Annual Review of Ecology, Evolution, and Systematics, 46, 523–549. doi.org, the Linnean, Wallacean and other shortfalls defined.
- Govaerts, R., Nic Lughadha, E., Black, N., Turner, R. & Paton, A. (2021). The World Checklist of Vascular Plants, a continuously updated resource for exploring global plant diversity. Scientific Data, 8, 215. nature.com, the names backbone used to reconcile every record.
- Goodman, S.M. (ed.) (1999). A floral and faunal inventory of the Réserve Naturelle Intégrale d'Andohahela, Madagascar: with reference to elevational variation. Fieldiana: Zoology, new series 94, 1–297. zenodo.org, the inventory of the humid-to-spiny gradient used as the worked example.
- International Finance Corporation (2012). Performance Standard 6: Biodiversity Conservation and Sustainable Management of Living Natural Resources; Guidance Note 6 updated June 2019. ifc.org, the critical habitat requirement for development-bank finance.
- IBAT Alliance (2026). Integrated Biodiversity Assessment Tool: pricing. ibat-alliance.org, published subscription tiers (USD 5,000 to 35,000 a year) and per-report prices (USD 750 to 7,500).
- Taskforce on Nature-related Financial Disclosures (2023). Recommendations of the TNFD, including the LEAP approach (Locate, Evaluate, Assess, Prepare). tnfd.global, the disclosure framework that begins by locating a company's interfaces with nature.
- Catalogue of the Vascular Plants of Madagascar. Missouri Botanical Garden, MNHN Paris and Parc Botanique et Zoologique de Tsimbazaza. tropicos.org, the national catalogue behind much of the island's specimen record.