How Madagascar's endemic flora ranks globally
Roughly 82 percent of its plants grow nowhere else. Set against other islands, floristic regions and the world's biodiversity hotspots, that number puts Madagascar in a category almost of its own. Here is the comparison, with the figures.
- About 82% of Madagascar's ~11,516 native vascular plant species are endemic, one of the highest endemism ratios of any large landmass (Antonelli et al., 2022).
- That is roughly 9,400 species found nowhere else, close to 3% of all ~343,000 accepted vascular plant species on Earth (WCVP; Govaerts et al., 2021).
- Madagascar was one of the original 25 biodiversity hotspots defined by Myers et al. (2000): places with ≥1,500 endemic plants that have lost ≥70% of their vegetation.
- Only far smaller islands beat its ratio (Hawaii ~89%), and no comparably rich flora matches it: scale and exclusivity together are what make Madagascar exceptional.
- IsoGentiX custody data show 1,656 endemics with no specimen in any Madagascar institution, and 537 known from a single specimen worldwide.
Endemism is a simple idea with a hard edge. A species is endemic to a place if it grows there and nowhere else. The higher a flora's endemism, the more of it is irreplaceable: lose a species from a country where it also grows elsewhere and the species survives; lose an endemic and it is gone from the planet. So the endemism ratio is not a curiosity. It is a measure of how much of a country's living heritage exists in one copy only.
By that measure Madagascar sits near the very top of the world. About 82 percent of its roughly 11,516 native vascular plant species are endemic (Antonelli et al., 2022; Callmander et al., 2011). The interesting part is not the number on its own but how it survives comparison. Plenty of places have a high endemism ratio, and plenty have a large flora. Very few have both at once. That combination is the whole of the story, and the data below is how you see it.
Native-species and endemism figures: Antonelli et al. (2022) and Callmander et al. (2011). The world total of ~342,953 accepted vascular plant species is from Kew's World Checklist of Vascular Plants (Govaerts et al., 2021); the ~2.7% share is Madagascar's ~9,400 endemics against that total. How the figures update →
The measure that matters: endemism ratio
There are two honest ways to rank a flora, and they tell different stories. You can count endemic species, in which case the winners are large countries with vast floras: Brazil, Indonesia, China and Australia each hold more endemic plants than Madagascar, simply because they are enormous and contain many biomes. Or you can measure the share of a flora that is endemic, in which case the picture inverts. Those same continental giants fall away, because most of what grows in them also grows across a border. A plant endemic to Brazil is still a South American plant; the lineage is shared with neighbours. On the ratio, the leaders become islands, where a barrier of ocean has kept lineages from spreading.
Madagascar is unusual because it does well on both. It has a flora large enough to rank among countries by absolute endemic count, and an endemism ratio that behaves like an island's, because it is one. The 82 percent figure is the tell. It means that for four in every five Malagasy plants there is no other source anywhere. That is a level normally reached only by small oceanic islands with a few hundred native species, not by a landmass carrying more than eleven thousand.
Continental floras win on count. Small islands win on ratio. Madagascar is the rare place that does not have to choose.
Madagascar against the other high-endemism floras
The table below places Madagascar beside the floras it is most often compared with: three islands or island groups famed for endemism, and one continental region, the Cape of South Africa, whose flora is so distinct it is treated as a floristic kingdom of its own. Every one of these is a place where isolation, whether by sea or by climate and soil, has produced an exceptional share of endemics. Read the columns together, not separately.
| Flora | Native vascular species | Endemic share | Land area (km²) | Endemics per 1,000 km² |
|---|---|---|---|---|
| Madagascar | ~11,516 | ~82% | 587,000 | ~16 |
| Cape Floristic Region (South Africa) | ~9,030 | ~69% | 90,000 | ~69 |
| New Caledonia | ~3,270 | ~75% | 18,600 | ~132 |
| New Zealand | 2,522 | ~82% | 268,000 | ~7 |
| Hawaiian Islands | ~1,000 (flowering) | ~89% | 16,600 | ~54 |
Sources by row: Madagascar, Antonelli et al. (2022); Cape, Goldblatt & Manning (2002); New Caledonia, Morat et al. (2012); New Zealand, New Zealand Plant Conservation Network (2,522 named native species, 1,984 endemic = 82.2%); Hawaii, Wagner, Herbst & Sohmer (1990). The final column is computed from the two preceding columns and land area, and is indicative, not a published figure. Endemism ratios are sensitive to how each flora is delimited, so treat the comparison as broad-brush.
Two things fall out of the table. First, the pure-density column flatters the small places. New Caledonia scores about 132 endemics per thousand square kilometres and Hawaii about 54, against Madagascar's 16, but only because the same kind of endemic count is squeezed into a far smaller area. Density rewards being tiny. Second, the absolute scale tells the opposite story. Madagascar's roughly 9,400 endemics are more than the entire native flora of New Caledonia, New Zealand and Hawaii combined, and its endemism ratio still stands level with New Zealand's and above New Caledonia's and the Cape's. No other flora in the table, and very few anywhere, holds that many endemics at that high a share.
The hotspot idea, and where Madagascar sits in it
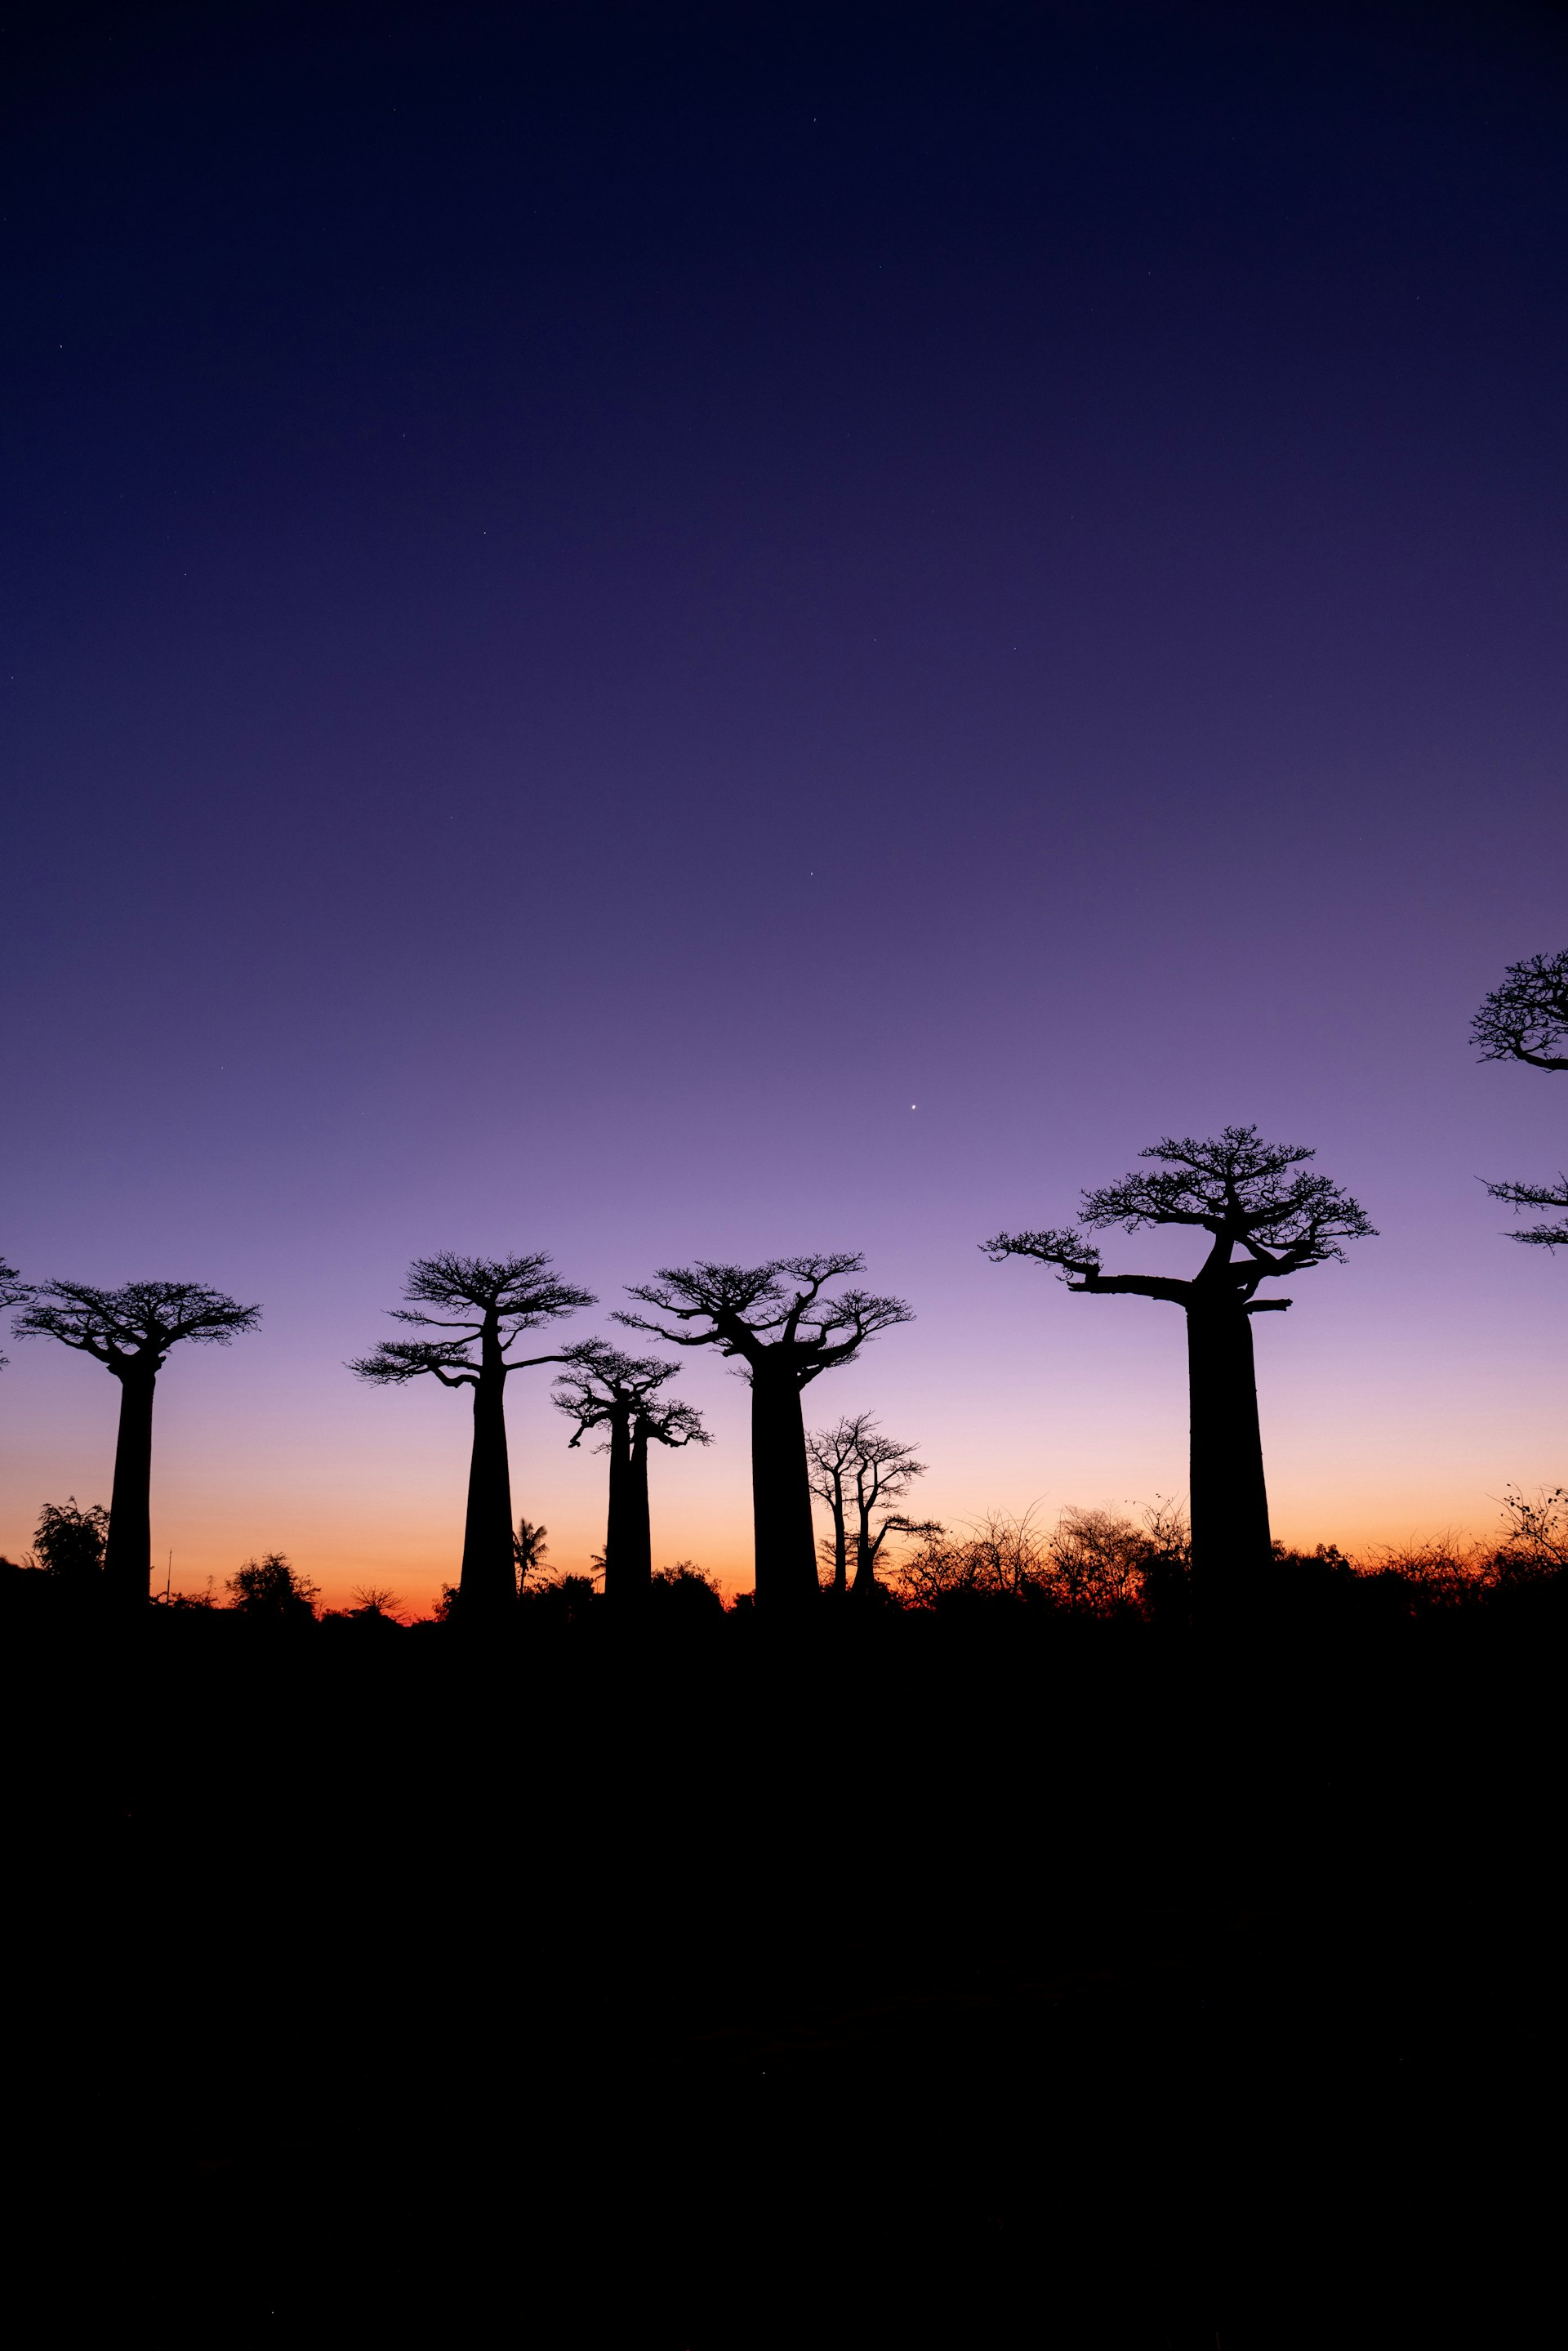
The modern language for all of this comes from a single paper. In 2000, Norman Myers and colleagues formalised the idea of a biodiversity hotspot: a region that both holds an exceptional concentration of endemic species and is under exceptional threat (Myers et al., 2000). To qualify, a region had to contain at least 1,500 endemic vascular plant species, more than 0.5 percent of the world's total, and to have already lost at least 70 percent of its original vegetation. Twenty-five regions met the bar. Together they covered just 1.4 percent of the planet's land surface, yet held around 44 percent of all vascular plant species as endemics.
Madagascar was one of the original twenty-five, folded into the wider Madagascar and Indian Ocean Islands hotspot. It does not scrape in. It clears the endemic-plant threshold by a factor of roughly six, and it clears the habitat-loss threshold too: the island lost around 44 percent of its natural forest between 1953 and 2014, and much of what remains is fragmented (Vieilledent et al., 2018). The hotspot framework was built to direct limited conservation money to where the most irreplaceable life is under the most pressure. On both halves of that test, endemism and threat, Madagascar is close to a worked example of what the authors had in mind.
Twenty-five hotspots, 1.4 percent of the world's land, about 44 percent of its vascular plant species as endemics (Myers et al., 2000). That is the concentration the framework was built to protect. Madagascar is one of the densest points in it: a single island carrying close to 3 percent of all known plant species, almost all of them found nowhere else.
How the counting is done, and why totals differ
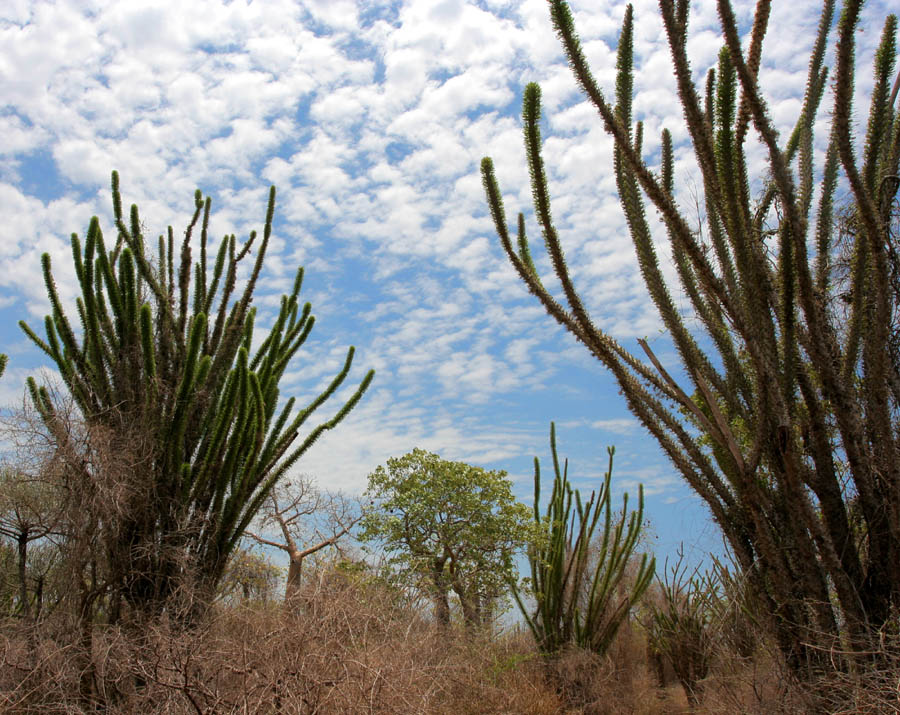
Rankings like these are only as sound as the lists behind them, and the lists do not all agree. The reference backbone most comparisons now use is Kew's World Checklist of Vascular Plants, which by 2021 recognised about 342,953 accepted vascular plant species worldwide (Govaerts et al., 2021). Measuring every country against the same checklist is what makes a ranking fair, because it applies one taxonomy everywhere rather than stitching together national lists that split and lump species differently.
That is also why published totals for a single country vary. A native-species count, an accepted-name count and a raw name count are three different things. The 11,516 native species and 82 percent endemism used here follow the published synthesis of Madagascar's flora (Antonelli et al., 2022). The larger figure of 13,685 shown elsewhere across this site is the IsoGentiX Flora Portal's tally of plant names recorded for Madagascar, native and naturalised alike, drawn from the same Kew checklist. A name count is always higher than a native-species count. The gap is a difference in what is being counted, not a disagreement about the plants.
A ranking measures how much irreplaceable flora a place has. Custody measures where the evidence for it sits. In the IsoGentiX dataset, 1,656 of Madagascar's endemic species have a preserved specimen somewhere in the world but none in any Madagascar institution, and 537 endemics are known from a single specimen anywhere on Earth. For a country that ranks this high on endemism, so much of the primary record held overseas is a matter of both science and sovereignty.
Custody figures are computed from the IsoGentiX Flora dataset (reconciled to the WCVP backbone) and reflect what has so far been digitised and localised.
Decoding is protecting
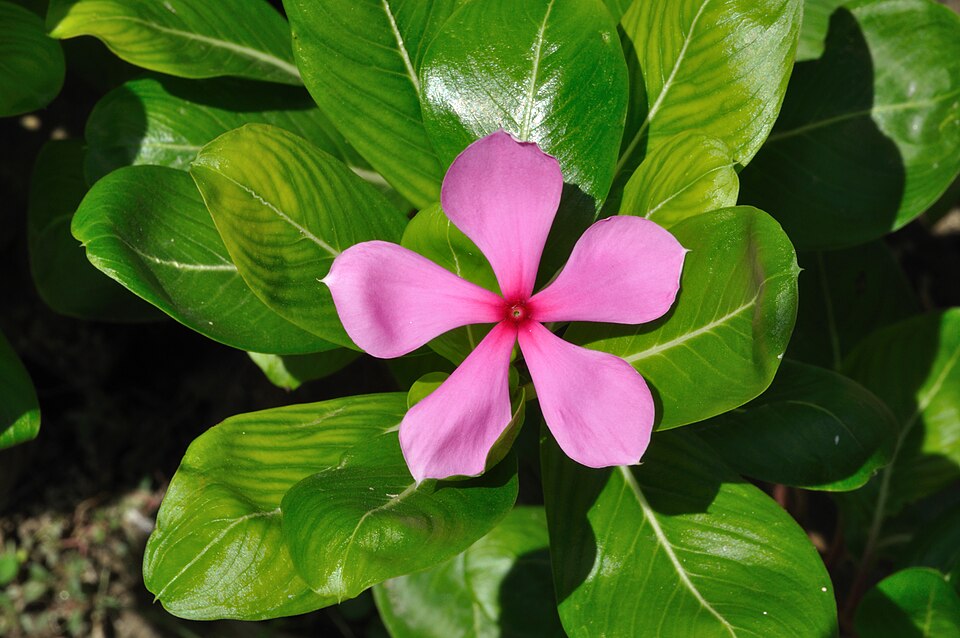
A high endemism ranking is a way of saying that a place holds a great deal that the rest of the world cannot supply. That is a reason to document it well, not a substitute for doing so. A species that is recorded, named, georeferenced and understood can be assessed for extinction risk, argued for in a management plan, and defended when land use is decided. A species that exists only as an undated sheet in a distant drawer cannot. Turning Madagascar's rank on the league table into a working, analysable record held in the country itself, so that the value of being this exceptional returns to the nation and communities that hold it, is the whole of the IsoGentiX purpose. Decode:Protect.
Common questions
How does Madagascar's plant endemism compare with other places?
About 82 percent of its roughly 11,516 native vascular plant species are endemic (Antonelli et al., 2022), one of the highest ratios of any large landmass. Only much smaller islands, such as Hawaii at about 89 percent, run higher, and none of them combine that ratio with a flora anywhere near Madagascar's size.
What is a biodiversity hotspot?
A region that holds at least 1,500 endemic vascular plant species and has lost at least 70 percent of its original vegetation (Myers et al., 2000). Twenty-five were identified in 2000, together holding about 44 percent of the world's vascular plant species in just 1.4 percent of its land area. Madagascar was one of them and clears both thresholds by a wide margin.
Which country has the most endemic plants?
Continental giants such as Brazil, Indonesia, China and Australia hold more endemic species in absolute terms, because their floras are vast. But their endemism ratios are far lower, often a third to a half. Madagascar is exceptional for combining a large flora with a very high ratio: almost everything that grows there grows nowhere else.
How much of the world's plant life is found only in Madagascar?
Roughly 9,400 endemic vascular plant species. Against the roughly 343,000 accepted vascular plant species known worldwide (WCVP), that is close to 3 percent, about one in thirty-six of all the plant species on Earth, confined to a single island.
Sources and further reading
- Myers, N., Mittermeier, R.A., Mittermeier, C.G., da Fonseca, G.A.B. & Kent, J. (2000). Biodiversity hotspots for conservation priorities. Nature, 403, 853–858. nature.com. The hotspot concept, the 1,500-endemic / 70%-loss criteria, and the 44% / 1.4% headline.
- Antonelli, A. et al. (2022). Madagascar's extraordinary biodiversity: evolution, distribution, and use. Science, 378(6623), eabf0869. science.org. ~11,516 native vascular species, ~82% endemic.
- Callmander, M.W. et al. (2011). The endemic and non-endemic vascular flora of Madagascar updated. Plant Ecology and Evolution, 144(2), 121–125. plecevo.eu
- Govaerts, R., Nic Lughadha, E., Black, N., Turner, R. & Paton, A. (2021). The World Checklist of Vascular Plants, a continuously updated resource for exploring global plant diversity. Scientific Data, 8, 215. doi.org. ~342,953 accepted vascular plant species worldwide.
- Goldblatt, P. & Manning, J.C. (2002). Plant diversity of the Cape Region of southern Africa. Annals of the Missouri Botanical Garden, 89(2), 281–302. missouribotanicalgarden.org. ~9,030 species, ~68.7% endemic across ~90,000 km².
- Morat, P., Jaffré, T., Tronchet, F., Munzinger, J., Pillon, Y., Veillon, J.-M. & Chalopin, M. (2012). The taxonomic reference base Florical and characteristics of the native vascular flora of New Caledonia. Adansonia, 34(2), 179–221. mobot.org. New Caledonia native flora and ~75% endemism.
- New Zealand Plant Conservation Network. New Zealand plants: how many, and how many endemic. nzpcn.org.nz. 2,522 named native vascular species, 1,984 endemic (82.2%).
- Wagner, W.L., Herbst, D.R. & Sohmer, S.H. (1990). Manual of the Flowering Plants of Hawaiʻi. University of Hawaiʻi Press & Bishop Museum. Around 1,000 native flowering plants, roughly 89% endemic.
- Vieilledent, G. et al. (2018). Combining global tree cover loss data with historical national forest-cover maps to look at six decades of deforestation and forest fragmentation in Madagascar. Biological Conservation, 222, 189–197. sciencedirect.com
- Govaerts, R. et al. World Checklist of Vascular Plants (WCVP) / Plants of the World Online. Royal Botanic Gardens, Kew. powo.science.kew.org. The taxonomic backbone the IsoGentiX figures reconcile to.
- Karimi, N. et al. (2026). Phylogenomic analysis of Madagascar's baobabs reveals admixed populations and supports resurrection of a previously described species. TAXON. Open access. onlinelibrary.wiley.com, the 2026 recognition of Adansonia bozy as a seventh Malagasy baobab.